
Manual YouTube Analytics vs AskLibra: How Long Does Each Actually Take?
Key Takeaways
- 1
Manual YouTube analytics can consume 3–5 hours per week pulling data from multiple dashboards — time that compounds into dozens of lost creative hours each month.
- 2
AskLibra consolidates channel data, engagement benchmarks, and posting recommendations into a single workflow, cutting analysis time to minutes rather than hours.
- 3
The real cost of manual analysis is not just time — it is delayed decisions, inconsistent tracking, and missed posting windows that compound into slower channel growth.
- 4
Creators who switch from manual spreadsheets to a structured analytics platform report clearer content direction and fewer wasted uploads based on incomplete data.
The Hidden Time Tax of Doing YouTube Analytics by Hand
Every YouTube creator eventually hits the same wall: you know your numbers matter, but pulling them together takes forever. You open YouTube Studio, screenshot a retention curve (the line graph showing what percentage of viewers are still watching at each moment of your video), export a CSV, paste it into a spreadsheet, then manually compare it against last month. Multiply that across 10, 20, or 50 videos and you have a part-time job that produces a static snapshot — not a living strategy.
This article breaks down exactly how long each approach takes, step by step, so you can make an honest comparison and decide where your hours actually belong.
What Manual YouTube Analytics Actually Involves
Manual analytics is not just "checking your numbers." It is a multi-step process spread across several tools and tabs. Here is what a thorough manual review looks like for a single channel in a given week:
Step 1 — Pulling Traffic Source Data (30–45 minutes)
You navigate to YouTube Studio's Analytics tab, select a date range, and manually record where your views are coming from — browse traffic, suggested videos, search, and external sources. Browse vs Search Traffic on YouTube: What's the Difference and Which Matters More? is a topic most creators research after realizing their traffic mix has silently shifted without them noticing. Identifying that shift manually means cross-referencing multiple sub-tabs and noting changes by eye.
Step 2 — Reviewing CTR and Thumbnail Performance (20–30 minutes)
CTR, or click-through rate, is the percentage of people who saw your thumbnail and actually clicked it. YouTube Studio shows this per video, but it does not rank your videos by CTR or flag which thumbnails are underperforming against your own channel average. You have to scroll, click into each video, note the number, and build that comparison yourself. Creators looking to How to Improve Your YouTube Thumbnail Click-Through Rate often spend more time finding the problem than fixing it because the diagnostic step is entirely manual.
Step 3 — Analyzing Hook Rate and Retention Curves (30–60 minutes)
Hook rate is the percentage of viewers who watch past the first 30 seconds of your video — a strong signal of whether your opening captured attention. What is a YouTube Hook and How Long Should It Be? Reviewing retention curves manually means opening each video's audience retention graph, identifying the drop-off points, writing notes, and then trying to find a pattern across multiple videos without any aggregation tool. This is the most time-intensive step and the one most creators skip when they are short on time — which means they keep making the same structural mistakes.
Step 4 — Tracking Engagement Rate (20–30 minutes)
Engagement rate measures the ratio of likes, comments, and shares to total views. YouTube Studio does not display a calculated engagement rate — you have to pull raw like counts and view counts, divide them, and track the result over time in your own spreadsheet. What Is Engagement Rate on YouTube and What's a Good Benchmark? Without a benchmark, you also cannot tell if your 2% engagement rate is strong or weak for your niche.
Step 5 — Identifying Best Posting Times (20–40 minutes)
YouTube Studio's "When your viewers are on YouTube" chart shows peak audience activity hours, but it shows it as a heatmap — not as a clear recommendation. You have to visually interpret the grid, compare it to your actual posting history, and guess whether the mismatch is costing you views. Creators who have done this work properly, as described in How One Creator Stopped Guessing and Grew 40% With Data-Driven Posting Times, found that the manual interpretation step was where errors crept in most often.
The Total Manual Time Cost
Add it up: a serious, thorough manual analytics review for a single channel takes 2 to 3 hours per week minimum. If you manage multiple channels, have a larger back catalog, or try to benchmark your numbers against niche averages, that figure climbs to 4–6 hours. Over a month, that is 8–24 hours spent on data collection rather than content creation — before you have made a single strategic decision.
What the Same Workflow Looks Like Inside AskLibra
AskLibra is designed around one premise: your analytics should answer questions, not generate more work. Here is how the same five-step review maps to the platform.
Connected Data in One Place (2–3 minutes)
When you connect your YouTube channel to AskLibra, your video library, traffic sources, CTR, engagement metrics, and retention signals are pulled and indexed automatically. There is no exporting, no tab-switching, and no manual data entry. What takes 30–45 minutes to assemble by hand is ready the moment you open the dashboard.
Engagement Benchmarks Built In (Instant)
Instead of calculating your engagement rate manually and wondering if it is good or bad, AskLibra surfaces your rate alongside niche benchmarks. You can see immediately whether your channel is above or below average for creators in your category — no external research required. This matters most for creators in higher-performing niches where the baseline is not obvious from YouTube Studio alone.
Posting Time Recommendations (Instant)
Rather than staring at a heatmap and guessing, AskLibra calculates your optimal posting window directly from your audience activity data and surfaces it as a clear number. This turns a 20–40 minute interpretive task into a zero-effort data point you act on rather than deliberate over.
Content Strategy in Minutes, Not Hours
Once your data is connected, AskLibra can help you move from raw metrics to a content direction — identifying which video formats are working, which topics retain viewers longest, and what your next upload should prioritize. How to Create a Content Strategy Using Only Your YouTube Analytics Data outlines this process in detail, and it is significantly faster when your data is already aggregated rather than scattered across Studio tabs.
For creators managing a recurring content calendar, How to Use AskLibra's Weekly Gameplan to Plan a Month of Content shows how a single weekly session inside the platform can replace what previously took several hours of manual spreadsheet work.
The Total AskLibra Time Cost
For a channel already connected to the platform, a complete analytics review — traffic sources, CTR signals, engagement rate, hook performance, and posting time — takes under 15 minutes. For a creator managing multiple channels, the time saved compounds further because all channels feed into a single interface rather than requiring separate manual sessions.
The Compounding Cost of Manual Analysis Errors
Time is not the only cost. Manual analytics introduces interpretation errors that compound over months. When you misread a retention curve, you might cut a section from future videos that was actually performing well. When you misjudge your best posting window, you publish into low-traffic periods and attribute the weak performance to the video's topic rather than its timing.
The Most Common Posting Mistakes YouTube Creators Make (Based on 90-Day Data) documents exactly these patterns — and most of them trace back to decisions made on incomplete or manually-assembled data.
There is also the consistency problem. Manual reviews happen when a creator has time, which means they happen irregularly. A platform like AskLibra gives you a consistent view of your channel every time you log in, which means your decisions are made against current data rather than a three-week-old export.
Side-by-Side Comparison
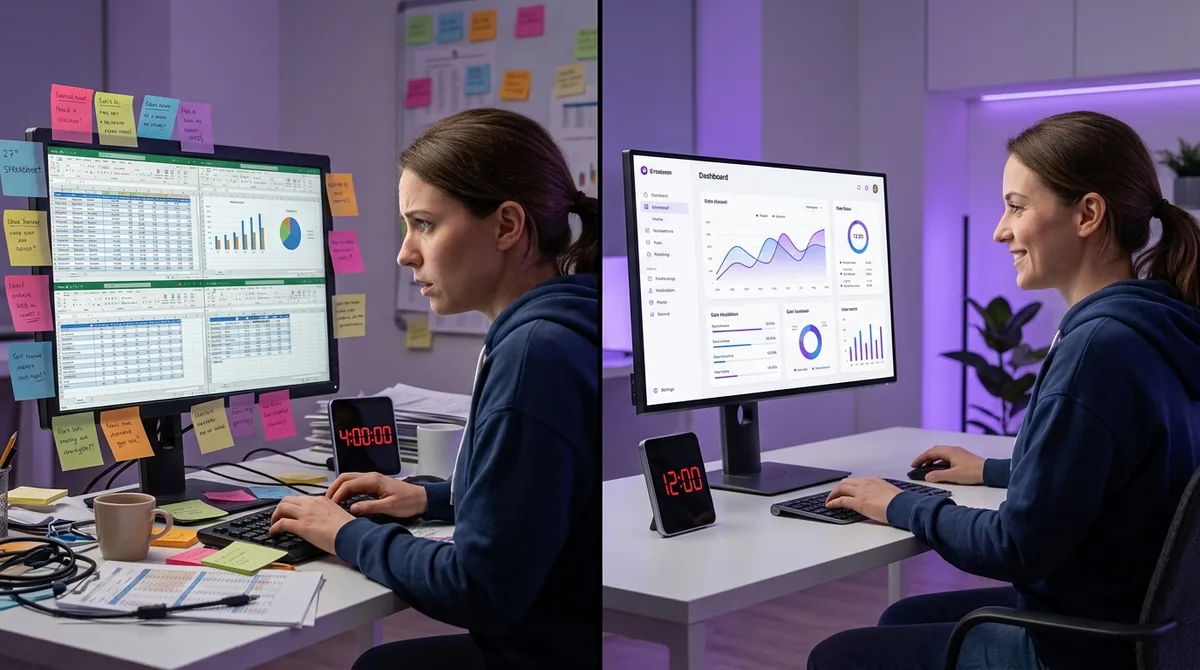
Manual Analytics: 2–6 hours per week. Requires spreadsheets, multiple Studio tabs, manual calculations, and external research to benchmark. High risk of interpretation errors. Difficult to scale across multiple channels. Produces a static snapshot.
AskLibra: Under 15 minutes per week. Data is aggregated automatically. Engagement benchmarks and posting recommendations are surfaced directly. Scales across channels. Produces an actionable, current view of channel health.
If you want to see how AskLibra compares to other tools in this category, AskLibra vs TubeBuddy vs VidIQ: Which Tool Actually Helps You Grow? covers the functional differences in detail. And if you want to understand how to build a full workflow around the platform rather than just using it for spot checks, How to Build a Complete Content System Using AskLibra is the logical next step.
Frequently Asked Questions
How long does a manual YouTube analytics review really take each week?
A thorough manual review — covering traffic sources, CTR, retention curves, engagement rate, and posting time analysis — takes between 2 and 6 hours per week depending on the size of your back catalog and how many channels you manage. Most creators underestimate this because they do partial reviews rather than systematic ones, which means they consistently miss patterns that would improve their results.
What is the difference between hook rate and retention curve?
Hook rate is a single number: the percentage of viewers who watch past the first 30 seconds of your video. The retention curve is a full graph showing viewer drop-off at every moment across the entire video. Hook rate tells you if your opening worked; the retention curve tells you where interest dropped throughout the video and which sections to rework.
Does AskLibra replace YouTube Studio entirely?
No — YouTube Studio remains the source of raw data and is where you manage uploads, community posts, and monetization settings. AskLibra connects to that data and restructures it so you spend time making decisions rather than assembling information. Think of Studio as the database and AskLibra as the analyst who has already done the work before you sit down.
Can manual analytics work if I am disciplined about it?
Yes, but discipline does not eliminate the time cost or the risk of interpretation error — it just makes the time cost consistent. Creators who are rigorous about manual analytics still spend several hours per week on a task that a connected platform handles automatically. The question is whether that time is better spent on analysis infrastructure or on content creation and audience engagement.
What metrics should I review every week regardless of which method I use?
At minimum, review CTR (click-through rate on your thumbnails), average view duration or VSAT (viewer satisfaction score, a measure YouTube uses to evaluate how much of your video viewers watch), engagement rate (likes, comments, and shares divided by views), and your top traffic sources for the week. These four signals give you a complete picture of whether your videos are being discovered, clicked, watched, and appreciated — and they point directly to which part of your funnel needs work.
Ready to see what the data says about your channel?
Stop guessing. Use AskLibra to get a personalized 90-day growth gameplan and find your perfect posting window.
No credit card required • Join 2,000+ creators