
Read YouTube Analytics Without Overwhelm
Key Takeaways
- 1
Most YouTube Analytics data is interesting but not actionable — narrow your focus to three core metrics.
- 2
Click-through rate, average view duration, and viewer satisfaction are the signals that drive YouTube distribution.
- 3
A simple decision framework helps you diagnose problems fast without spending hours in dashboards.
Start Here: Most of YouTube Analytics Is Noise
YouTube Studio gives you access to dozens of metrics — impressions, unique viewers, revenue per mille, card click rates, end screen clicks, and more. The problem is not a lack of data. The problem is that most of it does not tell you what to do next.
If you have ever opened the Analytics tab and felt your brain shut down, that is a normal response to information overload. The fix is not to learn every metric. The fix is to stop looking at most of them entirely.
Start with three numbers. Once you understand those, everything else becomes optional context rather than required reading. If you want a deeper breakdown of which numbers actually move the needle, 3 YouTube Metrics That Actually Matter covers the full argument for radical simplification.
The Three Metrics That Actually Drive Your Channel
1. Click-Through Rate (CTR)
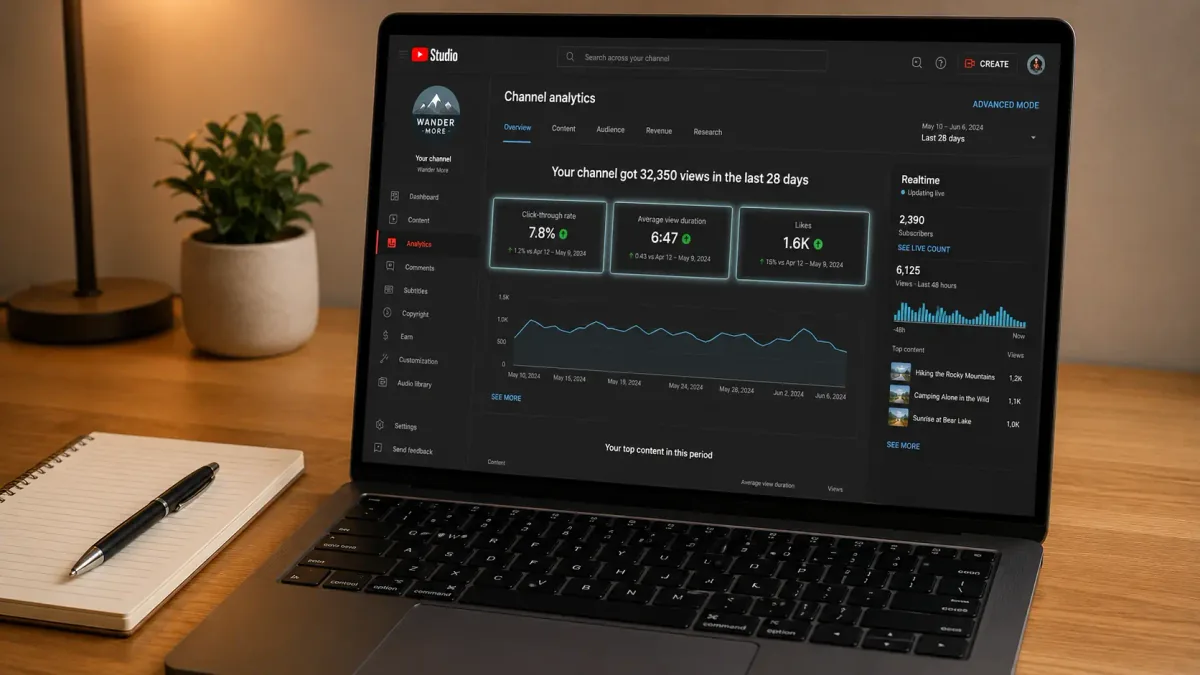
Click-through rate is the percentage of people who saw your thumbnail and title in their feed and chose to click. It tells you whether your packaging — not your content — is doing its job.
A low CTR means your titles and thumbnails are not compelling enough to earn the click. No amount of great content fixes that problem. YouTube will simply stop showing the video because it reads low CTR as audience rejection.
A healthy CTR varies by channel size and niche, but as a rough benchmark: anything above 4% is solid for established channels. New channels often see higher CTR early on because YouTube is still testing your content with targeted audiences.
2. Average View Duration (AVD)
Average view duration measures how long, on average, viewers actually watch your video. It is the primary signal of whether your content delivers on the promise your title and thumbnail made.
If your CTR is high but your AVD is low, you have a bait-and-switch problem. Viewers clicked, felt misled, and left. YouTube notices. It will reduce distribution as a result.
If your AVD is strong, YouTube interprets that as evidence that viewers found what they came for — and it will push the video to more people. Understanding the deeper relationship between satisfaction and distribution is covered thoroughly in How Viewer Emotion Shapes What YouTube Promotes.
3. Viewer Satisfaction (Likes, Comments, Shares, Saves)
Viewer satisfaction is the emotional layer on top of watch time. It captures whether viewers not only stayed but actively responded. Likes, comments, shares, and saves all signal to YouTube that the video created a reaction worth amplifying.
This is what the YouTube algorithm researchers call VSAT — viewer satisfaction score. It is one of the most underrated levers in channel growth. For a full explanation of how it works, see VSAT: The Only Metric That Matters for YouTube.
A Decision Framework for Reading Any Video's Performance
Use this checklist every time you review a video in YouTube Analytics. Work through it in order — do not skip ahead.
Step 1 — Check CTR. Is it above 4%? If yes, your packaging is working. If no, your thumbnail or title needs a rethink before you post the next video.
Step 2 — Check Average View Duration. Are viewers watching at least 40% of the video? If yes, the content is holding attention. If no, your hook, pacing, or structure is the problem — not the topic.
Step 3 — Check Satisfaction signals. Are likes and comments proportional to views? A like rate above 2-3% is healthy. Low satisfaction with high watch time suggests the content was tolerable but not memorable.
Step 4 — Identify the constraint. Every underperforming video has one root cause: weak packaging, weak content, or weak satisfaction. Fix the root cause before creating your next video.
Step 5 — Compare against your own channel average. Do not benchmark against other creators. Benchmark against your own historical performance. Is this video above or below your average CTR and AVD?
If you want to go deeper on diagnosing specific underperformance, Why Did My YouTube Video Underperform? walks through a structured diagnostic process.
What to Ignore (Until You Have Mastered the Basics)
These metrics exist in YouTube Studio and are not useless — but they are distractions until your core three are stable:
Impressions volume — Impressions tell you how often YouTube showed your video. But without CTR context, impressions alone mean nothing.
Traffic sources — Useful for advanced strategy, but not a priority when you are still diagnosing content quality.
Revenue per mille (RPM) — An output metric. It reflects what advertisers are paying. You cannot optimize it directly until your viewership is already healthy.
Subscriber gain per video — A lagging indicator. It improves as a byproduct of better content, not as a lever you pull directly.
Card and end screen click rates — These matter for funnel strategy, not growth fundamentals.
How Often Should You Check Analytics?
For most creators, checking analytics more than once per week creates anxiety without insight. The first 24-48 hours of data after publishing are unstable — YouTube is still testing the video with different audience segments. Early numbers shift dramatically.
A better cadence: check analytics three days after posting, then again at the seven-day mark. By day seven, you have a reliable read on CTR, AVD, and early satisfaction signals. That is enough to make your next content decision.
If you are spending more than 30 minutes per week inside YouTube Studio, the process itself may be the problem. Manual YouTube Analytics vs AskLibra: How Long Does Each Actually Take? breaks down where that time actually goes and what a faster alternative looks like.
Turning Analytics Into Your Next Video Decision
Analytics are only useful if they change what you do next. After every review session, you should leave with one clear action — not a list of observations.
Common actions that come from analytics review:
Rewrite your thumbnail copy because CTR dropped below your channel average on the last three videos.
Tighten your first 60 seconds because AVD is consistently low in the first minute across your last five uploads.
Double down on a topic because one video is outperforming your channel average on every metric.
For a structured way to use analytics data to decide what to post next, see What Should I Post Next on YouTube? — it turns your performance history into a posting decision rather than a reporting exercise.
Analytics without action is just a dashboard. The goal is to spend less time reading numbers and more time making better videos because of what those numbers told you. How to Use Data to See What Your YouTube Channel Needs shows how to build that habit systematically.
What to Do Next
Open YouTube Studio right now and find your three most recent videos. For each one, write down the CTR, the average view duration as a percentage, and the like rate. That is it. Do not look at anything else. Compare the three videos to each other and identify which metric is the weakest pattern across all three. That is your single constraint to work on before your next upload.
If pulling and comparing that data manually feels tedious, How to Create a Content Strategy Using Only Your YouTube Analytics Data shows a streamlined approach to turning raw numbers into a repeatable plan.
Frequently Asked Questions
How many metrics should I track in YouTube Analytics?
Three core metrics — click-through rate, average view duration, and viewer satisfaction signals — are enough to make every major content decision. Additional metrics become useful only after these three are consistently healthy across your channel.
What is a good click-through rate on YouTube?
For most channels, a CTR above 4% is considered solid. New channels often see higher CTR early because YouTube tests content with smaller, more targeted audiences. The most important benchmark is your own channel average, not an industry number.
When should I check my YouTube Analytics after posting?
Wait at least 72 hours before drawing conclusions. The first 24-48 hours are unstable as YouTube tests your video with different audience segments. A seven-day review gives you the most reliable read on CTR, watch time, and engagement patterns.
Why does my video have good views but low engagement?
High views with low engagement — likes, comments, shares — usually means the content was watched passively but did not create a strong reaction. YouTube's algorithm weighs satisfaction signals heavily, so passive viewership limits how widely it will distribute the video. Stronger calls to action and more emotionally resonant content tend to close this gap.
Can I use YouTube Analytics to predict burnout as a creator?
Yes — patterns in your posting frequency, engagement drops, and content consistency can surface early warning signs. Data Signals That Predict YouTube Creator Burnout outlines what to watch for before it becomes a serious problem.