
Data Signals That Predict YouTube Creator Burnout
Key Takeaways
- 1
Burnout rarely happens suddenly — your upload frequency, engagement trends, and average video length all show measurable decline weeks before you feel it.
- 2
Tracking the gap between your posting schedule and your actual output is one of the earliest and most reliable burnout indicators in your analytics.
- 3
Channels that diversify content formats — mixing long-form with Shorts or carousels — show more sustainable engagement patterns than single-format creators.
- 4
Using your own channel data to set realistic workload thresholds is more effective than copying another creator's posting cadence.
Why Creator Burnout Is a Data Problem, Not Just an Emotional One
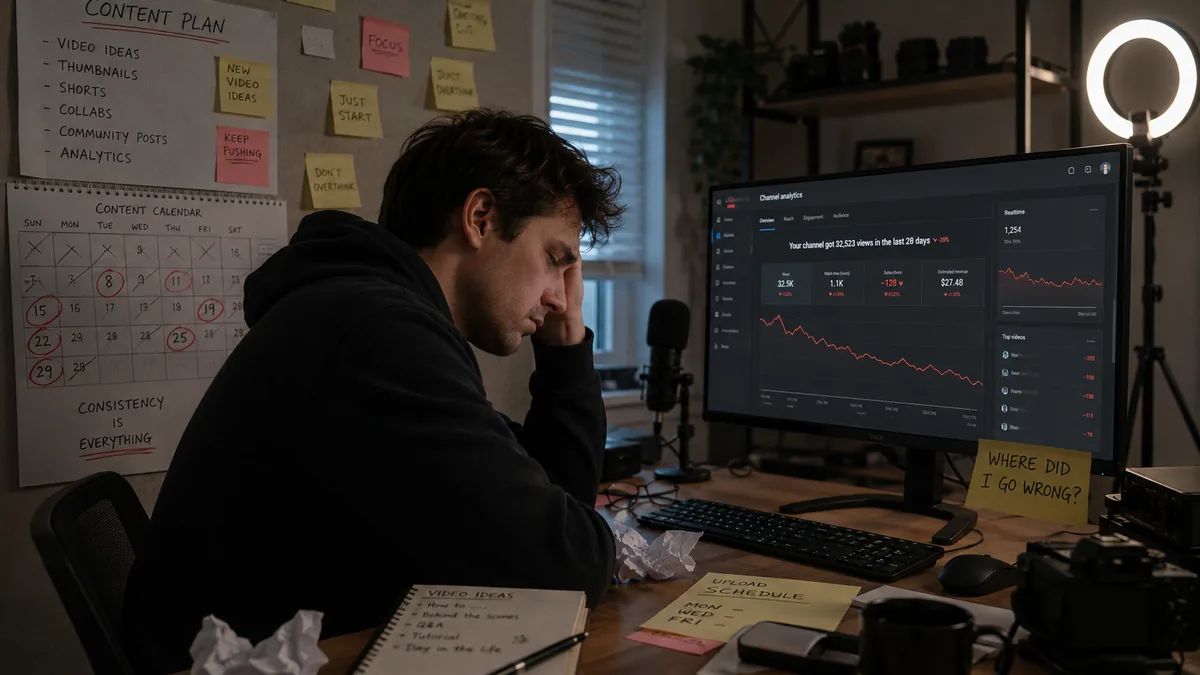
Most conversations about YouTube creator burnout focus on feelings: exhaustion, loss of motivation, creative dread. But by the time those feelings arrive, the data in your analytics has already been signaling distress for weeks — sometimes months. Burnout, at its core, is a mismatch between the energy you're putting into your channel and the feedback loop you're getting back. And that mismatch is measurable.
If you know which metrics to watch, you can catch burnout in its early stages — when it's still a trend, not a crisis. This article breaks down the specific analytics signals that precede creator burnout, and how to act on them before they derail your channel.
The 5 Data Signals That Predict Creator Burnout
1. Upload Frequency Drops Below Your Personal Baseline
Your upload frequency — how often you publish videos relative to your own historical average — is the single most reliable leading indicator of approaching burnout. It's not about whether you post once a week or once a month. It's about whether you're posting less than you normally do.
A 20–30% drop in upload frequency over a 6-to-8-week window is a concrete warning sign. Most creators rationalize it as a busy period. But when that drop persists across multiple consecutive weeks, the data is telling you something your conscious mind hasn't admitted yet: the system is under strain.
To track this accurately, calculate your 90-day rolling average of uploads per month, then compare it to your last 30 days. A single missed week is noise. A consistent downward trend is signal. Tools like Manual YouTube Analytics vs AskLibra: How Long Does Each Actually Take? can show you how much time you're actually spending on your channel — and where the friction is accumulating.
2. Average Video Length Shrinks Significantly
When creators are burning out, they unconsciously start cutting corners. One of the clearest expressions of this is video length compression. A creator who normally produces 12–15 minute deep-dives suddenly starts publishing 6-minute videos — not because the topic demands it, but because they don't have the energy to go deeper.
This matters because it's usually invisible to the creator themselves. You don't wake up and decide to make shorter videos. It just happens. But in your analytics, it shows up clearly as a downward trend in average video duration over 60–90 days.
Watch for a sustained 30%+ reduction in your average video length. That's not a format experiment — that's fatigue expressing itself through your content.
3. Engagement Rate Declines Before Views Do
Engagement rate refers to the ratio of interactions (likes, comments, shares) to total views on a given video. It's a measure of how emotionally connected your audience is to your content. And it tends to fall before your view count does — making it a leading, not lagging, indicator of channel health.
When a creator is burning out, the energy and specificity that made their content magnetic starts to fade. The videos become more generic, less opinionated, less personal. Audiences feel this before they can articulate it. They watch but don't comment. They finish the video but don't share it. What Is Engagement Rate on YouTube and What's a Good Benchmark? gives you the context to know whether your current numbers are a warning sign or within a normal range.
If your engagement rate has dropped more than 25% over your last 8–10 videos, and your content format hasn't changed, that's worth investigating immediately.
4. Topic Variety Collapses Into a Narrow Loop
Healthy channels show creative range over time, even within a niche. A burnout-prone creator starts recycling the same 2–3 topic angles repeatedly — not because those topics perform best, but because ideation has become too costly. Coming up with something new requires energy they don't have.
You can identify this by auditing your last 20 video titles and grouping them by core topic angle. If more than 60% cluster around the same 2 ideas, your creative range has contracted. This is both a symptom of burnout and an accelerant — repetitive content drives engagement down, which reduces motivation further, which narrows topics further.
A What Is a Content Pillar Strategy and How Do YouTube Creators Use It? framework can help you build out topic variety in a structured way that doesn't require reinventing the wheel every week.
5. Posting Time Drift
When creators are operating at full capacity, they're intentional about when they publish. They know their audience's peak engagement hours and they plan around them. As burnout sets in, that intentionality dissolves. Videos get published whenever they're finally finished — which is increasingly late at night, or on days when the creator is least prepared.
Posting time drift — the growing inconsistency between your scheduled upload time and your actual upload time — is a behavioral signal that your systems are breaking down. If you're supposed to post at 3pm on Tuesdays but your last six videos went live at 10pm, 7am, 2pm, 11pm, 4pm, and 6am, that randomness reflects operational strain, not flexibility.
Knowing your channel's optimal posting window and measuring how consistently you hit it is a clean, objective way to monitor your own sustainability. How One Creator Stopped Guessing and Grew 40% With Data-Driven Posting Times shows exactly how much posting time consistency affects reach.
Format Diversity as a Burnout Buffer
One of the most underappreciated burnout prevention strategies is format diversification. Based on AskLibra data from 4 connected channels and 511 videos analyzed, image and carousel formats generate significantly higher average engagement than short-form video alone — with image posts averaging 0.55 and carousel albums averaging 0.51, compared to 0.011 for Shorts.
This matters for burnout because creators who rely exclusively on one demanding format — like long-form talking-head videos — have no release valve. When energy dips, the only option is to produce the same expensive content at lower quality, or not post at all. Creators who mix formats have a middle option: a lower-effort format that still serves the audience and keeps the channel active during low-energy periods.
This doesn't mean abandoning your core format. It means having a deliberate secondary format you can fall back on. A How to Create a Content Strategy Using Only Your YouTube Analytics Data approach can help you identify which secondary formats your specific audience already responds to.
How to Use This Data Proactively
The goal isn't to monitor yourself obsessively. It's to set up a simple monthly review that flags anomalies before they compound. Here's a practical framework:
Monthly upload frequency check: Compare your last 30-day upload count to your 90-day average. Flag if it's down more than 20%.
Engagement trend review: Look at engagement rate across your last 10 videos. Flag if the trend line is consistently declining over 3+ videos.
Video length audit: Calculate average duration for your last 10 videos vs. your previous 10. Flag if there's a 30%+ reduction.
Topic diversity scan: Group your last 20 titles by core angle. Flag if more than 60% are variations of the same 2 topics.
Posting time consistency: Review actual publish times vs. intended publish times for the last 8 uploads. Flag if more than half missed your intended window by more than 4 hours.
Three or more flagged signals in the same monthly review is your cue to actively reduce load — not push through it.
What Burnout Prevention Actually Looks Like in Practice
The data signals described above are most useful when you treat them as permission to act early, rather than proof that you've already failed. Catching a 20% drop in upload frequency in week three is a very different situation than catching it in week twelve.
Early intervention looks like: reducing your upload commitment for 4–6 weeks, leaning into a lower-effort secondary format, batching content during high-energy periods to buffer low-energy ones, and resetting your expectations about what "consistent" means for your specific channel size and life situation.
For creators building authority beyond YouTube, it's also worth noting that burnout affects your discoverability in AI-powered search. Why Most Creators Are Invisible to AI Search (And How to Fix It) explains how content gaps and inconsistency directly reduce your chances of being cited by tools like ChatGPT and Perplexity. Sustained, consistent output — even at a lower volume — outperforms sporadic bursts followed by silence.
Frequently Asked Questions
How early can data signals predict creator burnout?
In most cases, measurable signals appear 4–8 weeks before a creator consciously acknowledges burnout. Upload frequency drops and engagement rate declines are typically the earliest indicators, followed by video length compression and topic narrowing.
Does posting less often always mean a creator is burning out?
Not necessarily. The key is whether the reduction is intentional or reactive. A planned schedule change is different from an unplanned drift downward. The signal becomes meaningful when frequency drops without a corresponding decision to change strategy.
Can a creator recover channel performance after a burnout period?
Yes, but recovery typically takes longer than the burnout period itself. Channels that maintain some level of activity during low-energy periods — even with lower-effort formats — recover faster than those that go completely dark. Audience retention and algorithm recovery both benefit from any continued presence.
Is there a safe upload frequency that prevents burnout?
There's no universal answer, because the threshold is personal. The right frequency is the one you can sustain for 12 months without degrading content quality or personal wellbeing. For most solo creators, that's 1–2 videos per week for long-form, or 3–4 Shorts per week — but your own 90-day baseline is a more reliable guide than industry averages.
How does burnout affect YouTube's algorithm treatment of a channel?
YouTube's algorithm responds to viewer behavior, not creator effort. When burnout causes engagement rates to fall and upload consistency to break down, the algorithm reduces distribution — not as punishment, but because the signals it uses to recommend content (watch time, engagement, return viewers) all weaken. This creates a feedback loop where reduced distribution leads to lower motivation, which leads to further burnout.
Ready to see what the data says about your channel?
Stop guessing. Use AskLibra to get a personalized 90-day growth gameplan and find your perfect posting window.
No credit card required • Join 2,000+ creators