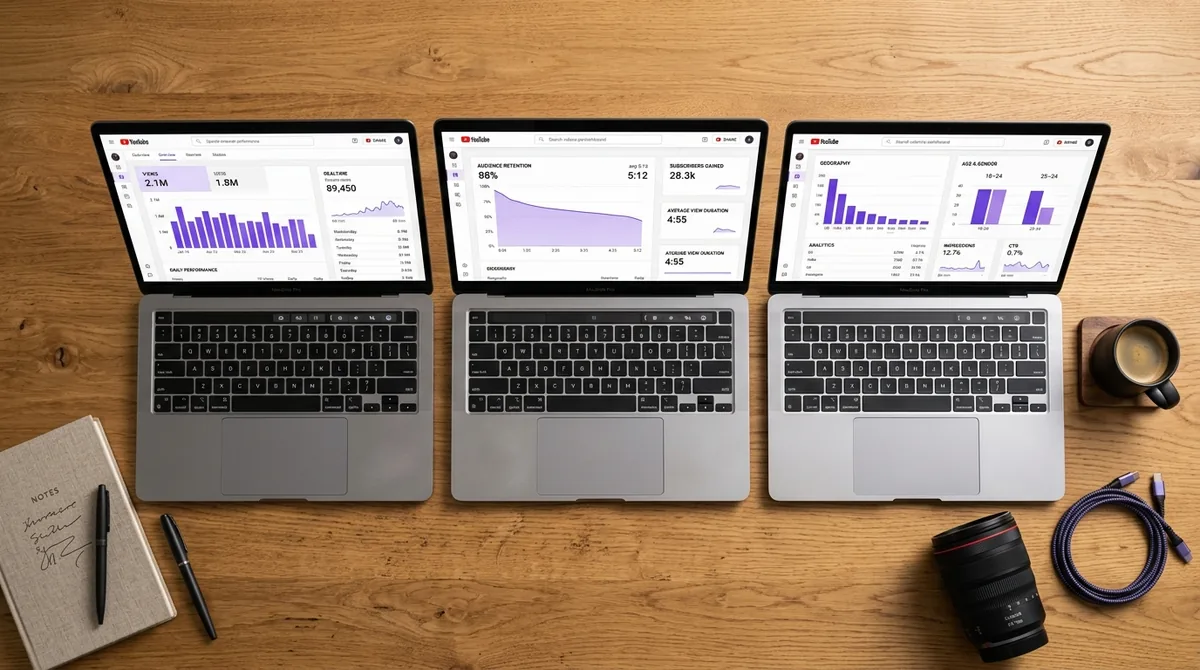


How to Create a Content Strategy Using Only Your YouTube Analytics Data
Key Takeaways
- 1
Your YouTube Studio analytics contain everything you need to build a repeatable content strategy — no guesswork, no trend-chasing required.
- 2
Four core metrics — audience retention, click-through rate (CTR), engagement rate, and traffic source — each answer a specific strategic question about what to make next.
- 3
Analyzing 90 days of your own data reveals patterns in format, topic, and timing that generic advice cannot replicate for your specific channel.
- 4
A data-driven content strategy is built in four steps: audit your top performers, identify your retention floor, map your traffic sources, and lock in a posting cadence backed by evidence.
Stop Guessing. Your Data Already Has the Answers.
Most creators treat their YouTube analytics dashboard like a report card — something to glance at after uploading, then close. That is the wrong mental model. Your analytics are not a scoreboard. They are a strategy document. Every number inside YouTube Studio is a signal telling you what your audience actually wants, when they want it, and in what format.
This guide walks you through a step-by-step process for turning raw YouTube analytics data into a concrete content strategy — without purchasing any third-party tool, hiring a consultant, or following generic advice about "posting consistently." If you want to understand why that phrase is actively harmful, read Why 'Post Consistently' Is Bad Advice — And What to Do Instead.
Step 1 — Audit Your Top 10 Performing Videos
Open YouTube Studio and navigate to Analytics > Content. Sort by Watch Time over the last 90 days. Write down the top 10 videos. Do not sort by views. Watch time is a more honest signal because it measures sustained interest, not just a click that bounced in four seconds.
For each of those 10 videos, note three things: the topic category, the video format (tutorial, story, list, reaction, etc.), and the approximate length. When you look at all 10 entries together, patterns will emerge. You may find that all your top watch-time videos are under eight minutes, or that every high-performer covers one specific sub-topic within your niche. That pattern is your content core — the territory where your channel already has proven traction.
This 90-day window matters because it filters out viral flukes and seasonal spikes. For a deeper look at what this time horizon reveals, see What 90 Days of YouTube Data Actually Reveals About Content Performance.
Step 2 — Read Your Retention Curve as a Script
Audience retention — the percentage of viewers still watching at any given moment in your video — is the most underused tool in a creator's analytics kit. YouTube displays this as a curve inside Analytics > Content > select a video > Engagement tab.
A healthy retention curve starts high, drops gradually, and does not cliff-dive in the first 30 seconds. Here is how to read it strategically:
The first 30 seconds: A steep drop here means your hook is not earning the viewer's continued attention. Your opening promise does not match what the video delivers. Learn the mechanics of fixing this in What is a YouTube Hook and How Long Should It Be?
Mid-video dips: Sudden drops mid-video mark the exact moment viewers decided the content stopped being useful. Timestamp that moment. Watch your own footage. You will almost always find a section that meanders, repeats itself, or introduces an unrelated tangent.
End-of-video dropoff: A gradual slope toward the end is normal. A sudden cliff at the 70% mark, however, usually means your conclusion arrived too early, or a sponsored segment was placed poorly.
Your retention curve is literally a timestamped script note. Use it to edit your next video differently, not just to feel bad about the last one. For a complete breakdown of what these numbers mean in practice, read YouTube Audience Retention: What the Numbers Actually Mean.
Step 3 — Decode Your Click-Through Rate and Impressions Together
Click-through rate (CTR) measures the percentage of people who saw your thumbnail and title in their feed and chose to click. A high CTR with low watch time means your title is misleading. A low CTR with high watch time means the people who do click love the content, but not enough people are clicking in the first place.
Read CTR and average view duration together, not in isolation. The goal is a video with both a healthy CTR (typically 4–8% for established channels) and strong average view duration. That combination tells the YouTube algorithm that the video satisfies viewers — which is the primary signal it uses to distribute content more broadly.
If your CTR is consistently below 3%, the fix is almost always in your titles and thumbnails, not in the content itself. For practical title-writing techniques, see How to Write a YouTube Video Title That Gets Clicked.
Step 4 — Map Your Traffic Sources to Understand Discovery
Inside Analytics > Reach, YouTube breaks down how viewers found your videos. The two sources that matter most for strategy are Browse traffic and Search traffic.
Browse traffic means YouTube's algorithm recommended your video on the home page or in the sidebar. These viewers were not looking for you — the algorithm served you to them based on their watch history. Browse-heavy channels need to optimize for broad appeal: compelling thumbnails, punchy titles, and topics with wide relevance.
Search traffic means someone typed a query and your video appeared. Search-heavy channels need to optimize for specificity: answering a clear question in the title, front-loading keywords in the description, and delivering exactly what the query promises.
Most channels do better with one of these two distribution models. Knowing which one drives your channel tells you whether to create content like a broadcaster (broad, entertaining, timely) or a librarian (specific, searchable, evergreen). For a full comparison of these two traffic modes, read Browse vs Search Traffic on YouTube: What's the Difference and Which Matters More?
Step 5 — Measure Engagement Rate to Find Your Most Loyal Viewers
Engagement rate on YouTube is calculated as the total number of meaningful interactions (likes, comments, shares, and saves) divided by total views, expressed as a percentage. A video with 10,000 views and 300 comments, likes, and shares has a 3% engagement rate.
High engagement rate on a video with modest views is more strategically valuable than low engagement on a viral hit. It means the topic triggered enough of a reaction that viewers felt compelled to respond. Those are your community-building topics — the ones worth repeating, expanding, and creating series around.
Sort your content by engagement rate (not just views) and look for outliers. A video with 800 views and a 6% engagement rate is telling you something that a video with 50,000 views and 0.4% engagement is not. For benchmarks and context, see What Is Engagement Rate on YouTube and What's a Good Benchmark?
Step 6 — Build Your Posting Schedule From Your Own Data
YouTube Analytics > Audience tab shows you two critical timing signals: when your subscribers are on YouTube, and the geographic breakdown of your audience. These two data points together define your optimal posting window — not some generic "post on Tuesday at 2pm" advice from a blog written for a completely different audience.
Publish your videos two to four hours before your audience's peak activity window. This gives the algorithm time to process the upload and begin distributing it before your most engaged viewers are online. If your audience peak is 6pm local time, publishing at 2–3pm is typically optimal.
One creator who applied this exact data-to-schedule methodology saw a 40% increase in reach within 90 days. Read the full case study: How One Creator Stopped Guessing and Grew 40% With Data-Driven Posting Times.
Step 7 — Choose Your Format Using Performance Data, Not Preference
The format question — Shorts vs. long-form, tutorials vs. vlogs — should be answered by your own analytics, not by what formats other creators in your niche are using. Pull your watch time and engagement data filtered by video length. If videos between 8–12 minutes consistently outperform your shorter and longer content, that is your proven format range.
The decision between Shorts and long-form is especially consequential because the two formats serve different algorithmic goals. Shorts build subscriber counts quickly but often attract passive viewers. Long-form builds watch time and deeper loyalty. For a structured framework for making this decision, see YouTube Shorts vs Long-Form: How to Decide What to Post.
Putting It All Together: Your One-Page Strategy
After completing the seven steps above, you should be able to fill in the following four-line strategy statement using only numbers and observations from your own analytics:
Content core: The 2–3 topic categories where your top 10 watch-time videos cluster.
Proven format: The video length and style that consistently produces the best retention and engagement.
Distribution model: Whether Browse or Search is your primary traffic source, and therefore whether you should optimize for broad appeal or specific queries.
Posting window: The day and time derived from your audience peak activity data.
This four-line document is a more useful content strategy than any 20-page editorial calendar built on gut instinct. For creators who want to scale this process across a full month of content planning, How to Use AskLibra's Weekly Gameplan to Plan a Month of Content shows exactly how to operationalize these analytics into a structured publishing schedule.
Frequently Asked Questions
How much data do I need before my analytics are reliable enough to build a strategy?
A minimum of 20 published videos and 90 days of data gives you enough signal to identify patterns that are not random. Below that threshold, a single viral or underperforming video can distort every metric. The 90-day window is the standard used by most serious channel analysts because it smooths out seasonal spikes and algorithmic fluctuations.
What is the single most important metric for building a content strategy?
Average view duration (also called audience retention) combined with watch time is the most strategically valuable pairing. These two metrics together measure whether your content actually delivers on what it promises — which is the core question your strategy needs to answer. CTR tells you if people click; retention tells you if they stay.
Should I look at my competitors' analytics when building my own strategy?
You do not have access to your competitors' internal analytics, and public data like view counts is not a reliable strategic signal. A video with 2 million views may have 40% audience retention and 0.3% engagement — metrics that indicate poor content performance despite surface-level popularity. Build your strategy from your own data first, then use competitor content only to identify topic gaps you have not yet covered.
How often should I revisit and update my content strategy?
Review your core metrics every 30 days and do a full strategic audit every 90 days. Audience behavior shifts, algorithm distribution patterns change, and your own content quality evolves. A strategy locked in place for six months will drift out of alignment with what your current audience actually responds to. The four-step audit process in this guide should take less than two hours each quarter.
What is CTR and what is considered a good benchmark for YouTube?
CTR stands for click-through rate — the percentage of viewers who clicked your video after seeing its thumbnail and title as an impression. Industry benchmarks suggest that 4–8% is a healthy range for established channels, while newer channels often see 2–4% as they build brand recognition. If your CTR is consistently below 3%, your thumbnails or titles are the first thing to test and improve.
Ready to see what the data says about your channel?
Stop guessing. Use AskLibra to get a personalized 90-day growth gameplan and find your perfect posting window.
No credit card required • Join 2,000+ creators