
Turn YouTube Studio Data Into Content Ideas
Key Takeaways
- 1
Your existing analytics reveal topic gaps, retention clues, and search patterns you can turn directly into new video ideas.
- 2
Four key Studio reports — Traffic Sources, Audience Retention, Search Terms, and Impressions CTR — each generate a different type of content idea.
- 3
A repeatable 5-step framework lets you run this process monthly so your content calendar is always driven by data, not guesswork.
Your Next Video Idea Is Already in YouTube Studio
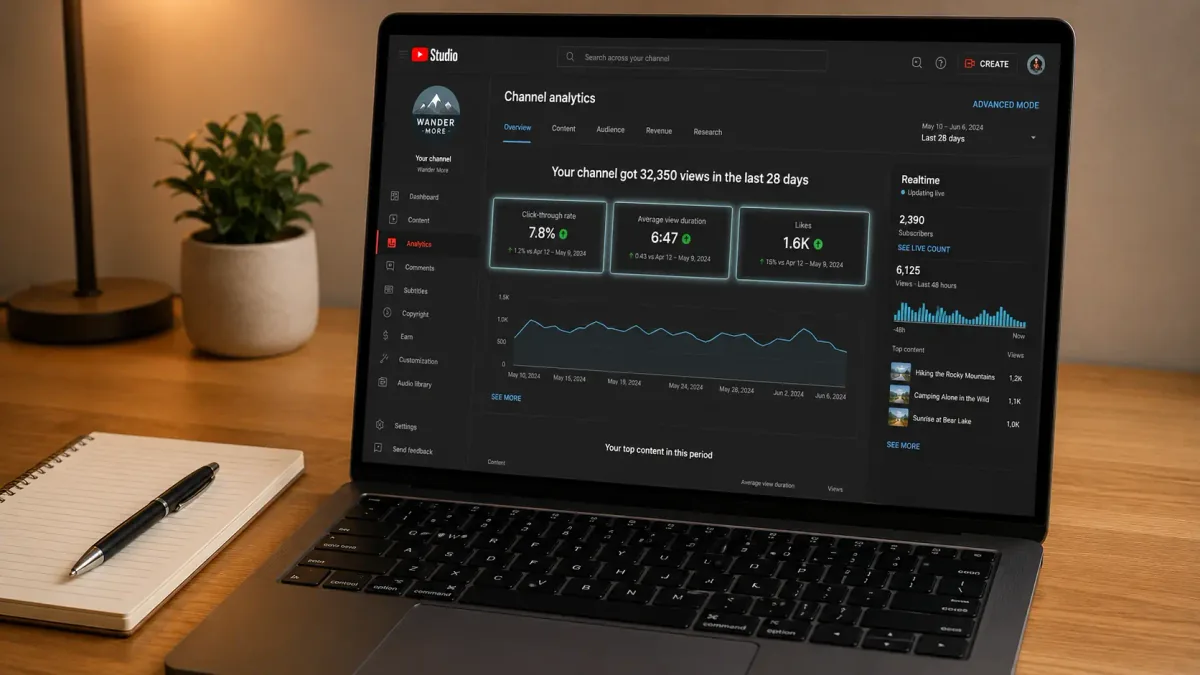
Most creators open YouTube Studio to check view counts and close the tab. That habit leaves the most valuable part untouched. The same dashboard that shows you what already worked contains a direct signal for what to make next. You do not need a keyword tool, a competitor audit, or a trend-chasing strategy. You need four reports and a repeatable reading method.
This article walks through exactly how to extract content ideas from YouTube Studio data — using your own channel's performance as the source material.
Which YouTube Studio Reports Generate Content Ideas?
Not every report in Studio is equally useful for ideation. These four are the ones that consistently surface actionable direction:
Audience Retention: Shows where viewers drop off or rewatch inside individual videos. Spikes and drop-offs are both idea signals.
Traffic Sources — YouTube Search: Reveals the exact phrases people typed before finding your videos. These are unmet demand signals hiding in plain sight.
Impressions and CTR: Tells you which topics your audience was shown but did not click. Low CTR on high-impression topics means the idea was right but the framing was wrong — which is a remake opportunity.
Top Videos by Watch Time (90-day window): Shows you what your audience rewarded with their time, not just a click. These are your proven topic categories worth expanding.
How to Read Retention Data as a Content Idea Source
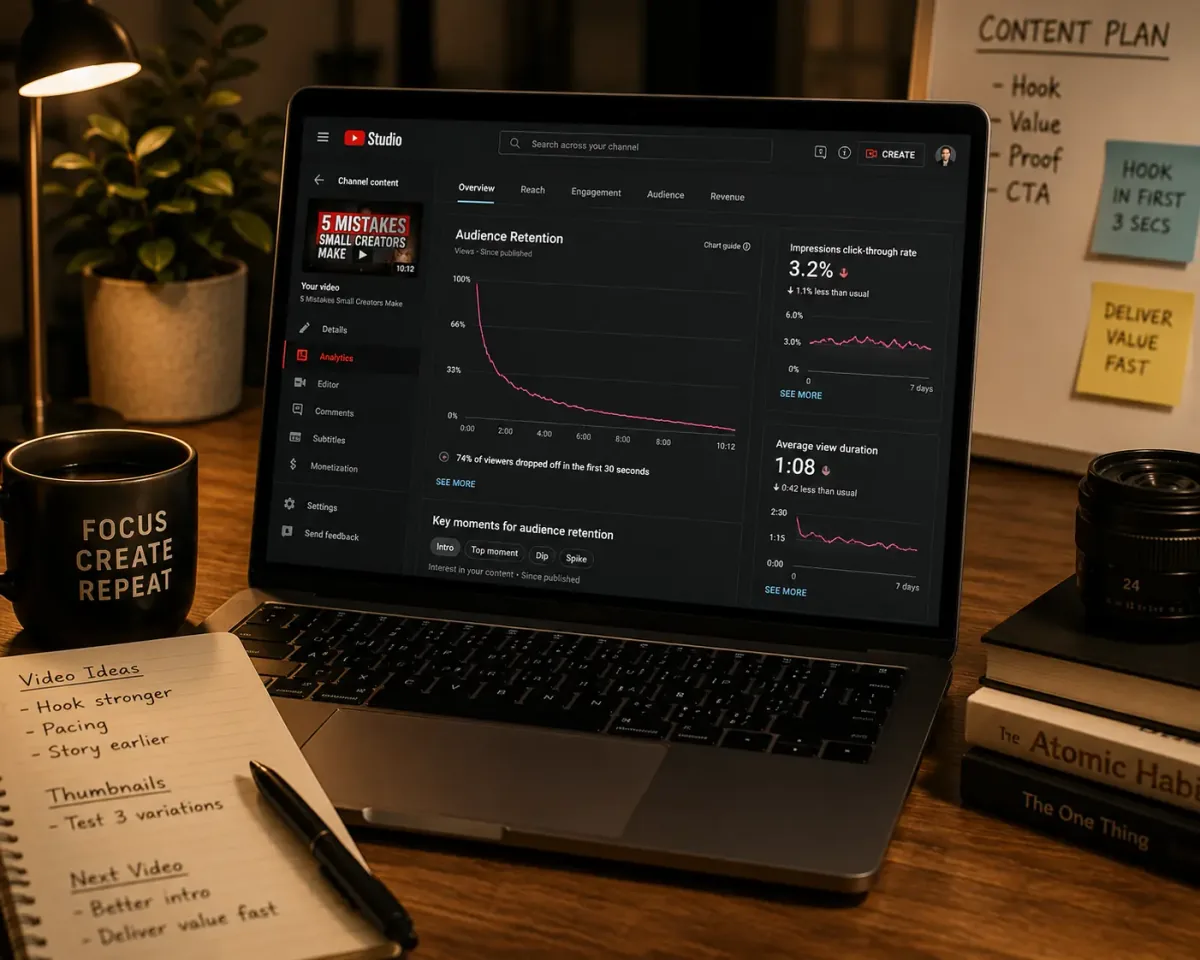
Open any video with at least 500 views in YouTube Studio and pull up the Audience Retention graph. You are looking for two things: sudden drop-off points and replay spikes.
A sharp drop at a specific timestamp usually means the viewer got what they came for — or hit something confusing. In either case, that moment marks a topic boundary. If viewers leave at minute 4 when you transition from "how" to "why," that transition is a natural video split. The second half could be its own video.
A replay spike — where the graph curves upward — is even more valuable. It means viewers rewound to hear something again. That specific sub-topic deserved a full video of its own. These spikes are especially reliable idea sources because they represent active audience interest, not passive viewing.
For a deeper look at what a sustained period of data actually reveals, see What 90 Days of YouTube Data Actually Reveals About Content Performance.
How to Mine Your Search Terms Report
Go to YouTube Studio → Analytics → Reach → Traffic Sources → YouTube Search. Filter to the last 90 days. Export the list.
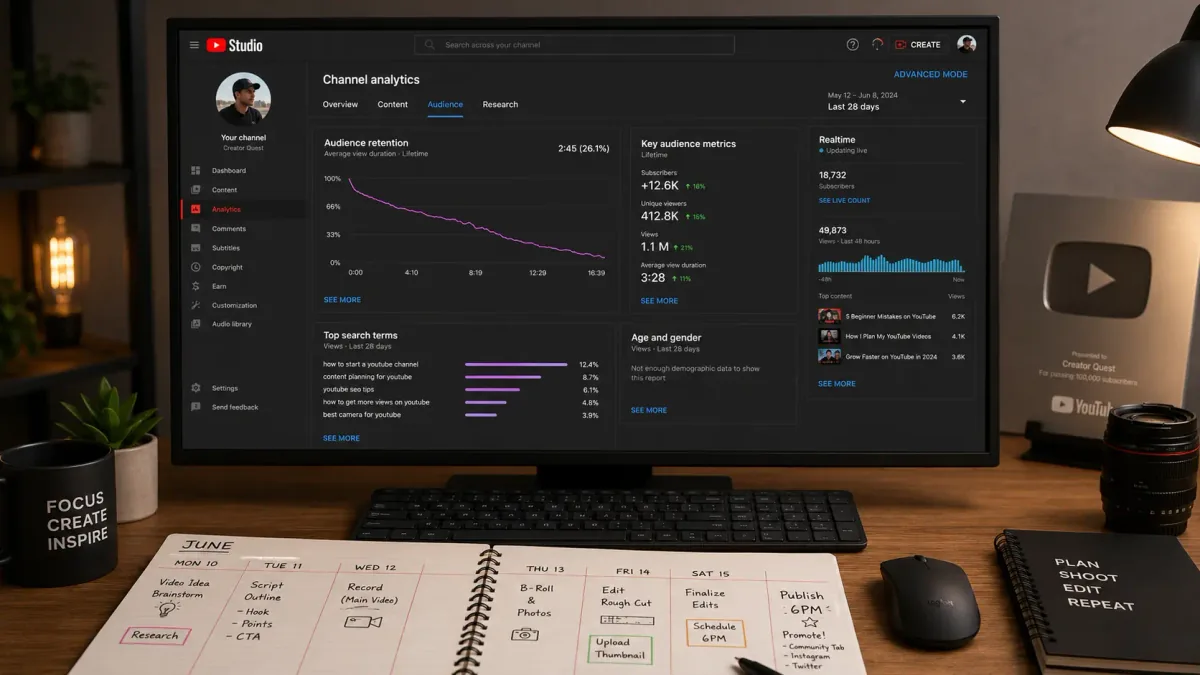
You will see the exact queries that brought people to your videos. Sort by impressions. Any phrase with significant impressions that led to a video that is not directly about that topic is a gap. That phrase is what someone searched, your video appeared, and they watched anyway because it was close enough. A dedicated video on that exact query would perform better because it would match intent more precisely.
Look also for multi-word variants of the same concept. If you see "how to stage a home," "home staging tips," and "staging a house before selling" all appearing separately, those are signals that a comprehensive video on home staging — or a short-form series — has existing search demand behind it.
This process connects naturally to building a repeatable system. The article How to Create a Content Strategy Using Only Your YouTube Analytics Data shows how to take these raw search signals and structure them into a full content plan.
CTR as a Reframe Signal, Not a Failure Signal
A video with high impressions and low CTR is not a failed topic. It is a failed frame. YouTube showed your thumbnail and title to a relevant audience repeatedly, and they chose not to click. The topic had reach potential. The presentation did not convert it.
Pull your last 20 videos sorted by impressions. Any video with impressions above your channel average but CTR below 4% is a candidate for a remake with a reframed title and thumbnail. Same topic, different angle or hook. This is one of the fastest ways to extract value from existing Studio data without creating anything new from scratch.
The 5-Step Monthly Idea Extraction Framework
Run this process once per month, ideally after you have at least 10 videos live. It takes 20 to 30 minutes.
Step 1 — Top 5 by Watch Time: List your five highest watch-time videos from the past 90 days. Identify the core topic of each. These are your proven pillars. Plan at least one follow-up or deeper-dive video on each pillar per quarter.
Step 2 — Retention Spike Audit: Open your top 3 videos and scan retention graphs for replay spikes. Write down the sub-topic at each spike. Each one is a standalone video idea.
Step 3 — Search Term Gap List: Export your Search Terms report. Flag every query where the traffic landed on a video that was only loosely related. List those queries as dedicated video ideas.
Step 4 — CTR Reframe List: Identify 2 to 3 high-impression, low-CTR videos. Add them to a reframe queue — same topic, new title and thumbnail treatment.
Step 5 — Cluster and Prioritize: Group your ideas by topic cluster. Schedule the highest-search-demand ideas first, retention spike ideas second, and reframes third. You now have a data-backed content calendar.
For a framework on how your first batch of uploads can accelerate this feedback loop, see The 20-30 Video Data Feedback Loop: How to Turn Your First Month of Uploads into a Growth Roadmap.
When Your Data Is Too Thin to Read
If your channel has fewer than 20 videos or most videos have under 200 views, your retention and CTR data will not be statistically reliable. In that window, lean more heavily on the Search Terms report — even small channels generate usable query data faster than retention signals stabilize.
You can also supplement your own thin data with topic validation from audience behavior patterns. The article How to Use AI to Generate YouTube Video Ideas That Actually Match Your Audience covers how to layer external signals when your own data set is still building.
What to Do Next
Open YouTube Studio right now. Go to Analytics → Content → Sort by Watch Time, 90-day filter. Write down the top 5 topics. Then go to Reach → Traffic Sources → YouTube Search and copy your top 20 search queries into a doc. You now have a raw idea bank sourced entirely from your own data. Run the 5-step framework above to turn that raw list into a prioritized content calendar.
If you want a structured way to track and act on these signals over time, How to Use Data to See What Your YouTube Channel Needs walks through how to build that system.
Frequently Asked Questions
How often should I mine YouTube Studio for content ideas?
Once per month is the right cadence for most creators. Running it more frequently on a small channel produces noise rather than signal. Wait until each batch of videos has had at least 3 to 4 weeks to accumulate watch time and search traffic data before drawing conclusions.
Which YouTube Studio report is most useful for finding content ideas?
The Traffic Sources — YouTube Search report is the single most direct idea source because it shows real queries from real people who were already looking for your content. Audience Retention spikes are the second most reliable signal, as they reflect active re-engagement rather than passive viewing.
What if my CTR is low across all my videos?
Low CTR across the board usually points to a thumbnail or title system problem, not a topic problem. Before using CTR data for idea generation, audit your titles and thumbnails first. Once CTR variance appears across your catalog, you can use the high-impression outliers as reframe candidates.
Can I use this method if I only have 10 videos?
Yes, but rely primarily on the Search Terms report. Retention and CTR signals need more data volume to be meaningful. With 10 videos, your search query list will still surface 15 to 30 real phrases you can build future videos around, even if the retention graphs are not yet reliable.
How is this different from using a keyword research tool?
Keyword tools show you what people search broadly across YouTube. Your Studio Search Terms report shows you what people searched and then found your channel specifically. That distinction matters — these are warm signals tied to your existing audience relevance, not cold market data. Both have value, but your own Studio data is more precise for your channel's specific positioning.