YouTube Creator Burnout: The Data Signals That Predict It Before It Happens
Key Takeaways
- 1
Burnout rarely arrives without warning — your analytics dashboard shows early stress fractures weeks before motivation collapses, including drops in upload consistency, shrinking average view duration, and declining hook rate.
- 2
Posting frequency spikes followed by sudden gaps are one of the strongest behavioral predictors of creator burnout, and tracking the pattern over a 30-90 day window gives you time to intervene.
- 3
Format fatigue — the slow erosion of engagement when a creator keeps producing the same content type despite diminishing returns — is measurable and often precedes a full creative shutdown.
- 4
Creators who schedule content reviews using channel analytics at least twice per month are significantly better positioned to catch burnout signals early and adjust their strategy before output quality crumbles.
Why Burnout Feels Sudden — But Isn't
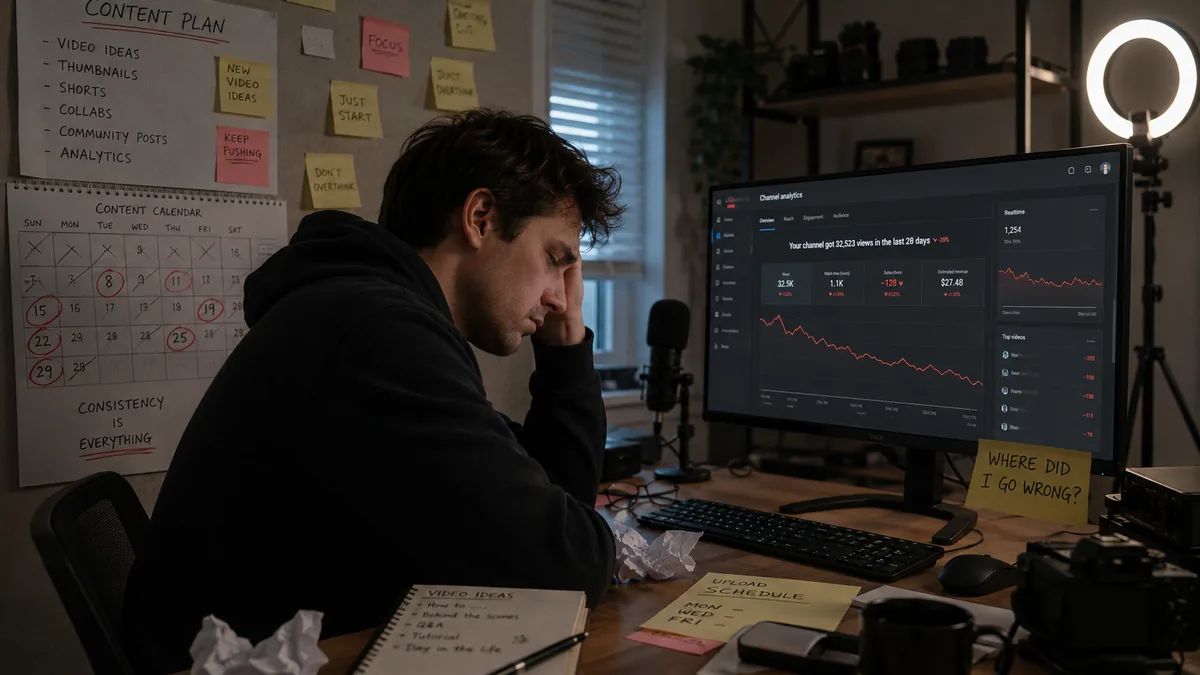
Every creator who has burned out describes the same experience: one day the camera felt heavy, the edit felt impossible, and the upload button felt like a cliff edge. It seemed to happen overnight. But the data tells a different story.
Creator burnout is not a sudden event. It is a slow accumulation of misaligned effort, unread warning signs, and decisions made without the feedback that analytics can provide. The signals exist in your dashboard weeks — sometimes months — before your motivation gives out entirely. The problem is that most creators are not taught to look for them.
This article breaks down the specific, measurable data patterns that precede burnout, and what to do when you spot them on your own channel.
Signal 1: The Frequency Spike Before the Gap
One of the most reliable pre-burnout patterns in creator behavior is a sharp increase in upload frequency followed by a hard stop. A creator who normally posts twice a week suddenly pushes to five times a week — often because of a viral moment, a revenue spike, or external pressure — and then disappears for three to six weeks.
This is not laziness. It is the body and mind responding to an unsustainable output rate. The spike depletes creative reserves faster than they can be replenished, and the gap is the system forcing a reset.
What to watch in your analytics: Track your upload cadence over rolling 30-day and 90-day windows. If you see a pattern where your output accelerates by more than 50% above your baseline for more than two consecutive weeks, treat it as a yellow flag. You are borrowing from future motivation to fund present output — and the debt will come due.
If you want to understand how posting frequency patterns affect your channel performance beyond just burnout risk, Why 'Post Consistently' Is Bad Advice — And What to Do Instead offers a data-grounded reframe of what consistent posting actually means.
Signal 2: Declining Hook Rate
Hook rate is the percentage of viewers who continue watching your video past the first 30 seconds. It is one of the most sensitive early indicators of content quality, and content quality is one of the first things that degrades when a creator is approaching burnout.
When you are operating under creative fatigue, your hooks become generic. You stop experimenting with the opening frame, the first line of script, or the thumbnail promise. The ideas feel stale because you have not had the mental space to generate fresh ones. Viewers feel this immediately — they click away faster, your hook rate drops, and YouTube's algorithm quietly reduces your distribution.
What to watch: If your hook rate — measured as the percentage of viewers who pass the 30-second mark — drops more than 15-20% below your personal channel average across three or more consecutive videos, this is a meaningful signal. It is not just an algorithm problem. It is a creative fatigue problem wearing an algorithm mask.
For a deeper look at what a strong hook looks like technically, What is a YouTube Hook and How Long Should It Be? is a useful reference point.
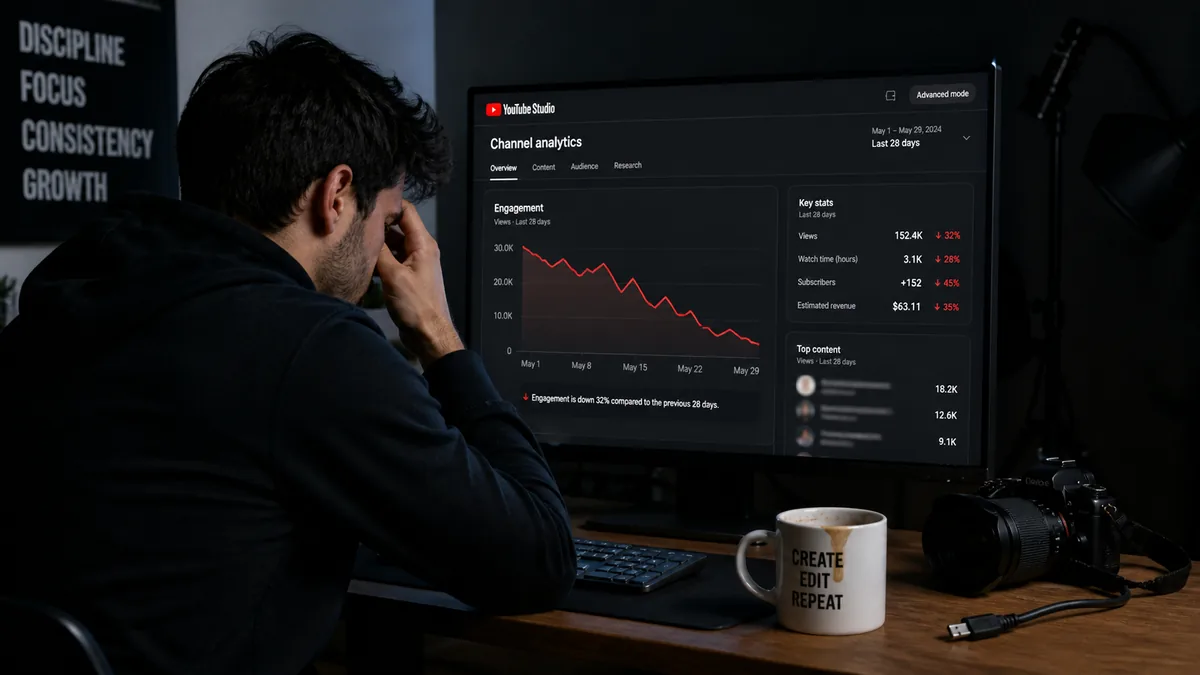
Signal 3: Flat or Falling Engagement Rate
Engagement rate is the ratio of meaningful viewer interactions — likes, comments, shares, saves — to total views. It tells you how much your audience cares about what you made, not just whether the algorithm served it to them.
A gradual decline in engagement rate across a 60-90 day window, even when views hold steady, is a sign that your content is becoming less resonant. Burnout-adjacent content tends to be technically correct but emotionally flat. You are executing the format without the specificity, curiosity, or genuine investment that makes viewers feel something worth responding to.
For benchmarks on what a healthy engagement rate looks like by channel size and niche, What Is Engagement Rate on YouTube and What's a Good Benchmark? provides a structured breakdown.
Signal 4: Format Fatigue
Format fatigue occurs when a creator repeats the same content structure — same intro style, same section breakdown, same outro call-to-action — until both the creator and the audience have stopped engaging with it meaningfully. It is distinct from a bad video; format fatigue is the slow erosion of engagement from a format that used to work but has been over-mined.
The data signature of format fatigue looks like this: your best-performing format three months ago now consistently underperforms your channel average. You have not changed the topic or the quality. You have simply exhausted the novelty of the structure for your specific audience.
Based on AskLibra data from 4 connected channels and 511 videos analyzed, image and carousel content formats significantly outperform long-form video in engagement rate — which suggests that creators who diversify their format mix rather than doubling down on a single structure tend to maintain audience responsiveness longer. Format variety is not just creative — it is protective.
If you are trying to make a deliberate decision about which formats to invest in next, YouTube Shorts vs Long-Form: How to Decide What to Post walks through the trade-offs with data.
Signal 5: Collapsing Average View Duration (VSAT)
Average View Duration, sometimes called Video Satisfaction Score or VSAT in platform analytics contexts, measures how much of your video the average viewer actually watches. It is one of the most direct signals of content value.
When VSAT starts dropping — particularly if it falls in the middle section of your videos rather than at the beginning or end — it often reflects a structural issue: your content has lost the internal tension that keeps viewers watching. This internal tension is one of the first things a burned-out creator stops building intentionally. The ideas are present, but the pacing, the stakes, and the sense of forward motion go flat.
Watch for VSAT declines of more than 10-15% from your 90-day average sustained across four or more consecutive uploads. A single video underperforming is noise. A sustained trend is a signal worth acting on.
Signal 6: Topic Scatter
A creator with a strong content strategy has clear pillars — defined topic areas they return to repeatedly that build audience expectation and channel authority. When burnout approaches, topic scatter increases. Videos stop fitting the pillar structure. Uploads become reactive — chasing trends, copying competitors, or simply publishing whatever required the least creative energy to complete.
Topic scatter is visible in your analytics as a fragmentation of your traffic sources. Search traffic, which rewards specificity and topic depth, tends to fall. Browse traffic becomes more variable and harder to predict. Your subscriber growth rate often slows because new viewers cannot quickly understand what your channel is about.
For a structured approach to maintaining topic coherence under pressure, What Is a Content Pillar Strategy and How Do YouTube Creators Use It? provides a practical framework. Understanding the difference between browse and search as traffic sources is also worth reviewing — Browse vs Search Traffic on YouTube: What's the Difference and Which Matters More? explains both in plain terms.
How to Build an Early Warning System Into Your Workflow
Knowing which signals to watch is only useful if you have a routine that surfaces them before they compound into a crisis. Most creators review their analytics reactively — they check after a video underperforms, not before one is produced in a state of depletion.
A simple early warning system has three components. First, set a baseline: calculate your personal channel averages for hook rate, engagement rate, and VSAT across your last 20 videos. These are your reference numbers, not industry benchmarks. Second, schedule a bi-weekly review — 20 to 30 minutes every two weeks to compare your most recent uploads against your baseline. Third, define thresholds in advance: decide now what percentage decline in each metric triggers a pause for reflection rather than more output.
If the idea of building this kind of structured review feels time-consuming, Manual YouTube Analytics vs AskLibra: How Long Does Each Actually Take? provides an honest comparison of the time investment involved in doing this manually versus using a dedicated tool.
For creators who want a structured way to move from data review to content planning, How to Use AskLibra's Weekly Gameplan to Plan a Month of Content shows how a data-informed planning rhythm can replace reactive, exhausting decision-making.
The Mistake Most Creators Make When They See These Signals
When engagement drops or VSAT declines, the instinctive response for most creators is to post more. More volume, more formats, more topics — as if quantity can solve what is actually a quality and sustainability problem. This is almost always the wrong move.
The data signals described above are the channel's way of telling you that the current system is not working. Adding more output to a broken system does not fix the system — it accelerates the breakdown. The correct response is to post less, review more, and use the data to make the next video count rather than to produce the next three videos faster.
The Most Common Posting Mistakes YouTube Creators Make (Based on 90-Day Data) documents this pattern with real channel data and explains why the volume-as-solution instinct consistently backfires.
Frequently Asked Questions
How early can data signals predict creator burnout?
In most cases, measurable signals — declining hook rate, frequency spikes, and falling VSAT — appear four to eight weeks before a creator experiences a complete motivation collapse. Reviewing your analytics bi-weekly gives you enough lead time to adjust your schedule, take a planned break, or shift formats before output quality deteriorates significantly.
What is the single most reliable early warning sign of burnout in analytics?
Upload frequency spikes followed by sudden gaps are the most consistent behavioral pattern. A sharp increase in posting rate above your personal baseline — sustained for two or more weeks — is a strong predictor that a creative crash is coming. Tracking your cadence over rolling 30 and 90-day windows makes this pattern visible before the gap actually occurs.
Does burnout always show up as declining view counts?
Not initially. In many cases, views hold steady or even increase during the early stages of burnout because the algorithm continues distributing content based on historical performance. The more sensitive early indicators are engagement rate, hook rate, and average view duration — these reflect audience resonance and tend to decline before view counts do.
What is format fatigue and how is it different from topic fatigue?
Format fatigue is a decline in audience engagement caused by overusing the same content structure — the same intro style, pacing, and section format — regardless of topic. Topic fatigue, by contrast, occurs when a creator exhausts a subject area. Both are measurable in analytics, but format fatigue tends to be easier to fix because changing your structure does not require finding entirely new ideas, just presenting existing ideas differently.
Can a creator recover from burnout without taking a complete break from posting?
Yes, but only if the root cause is addressed. If burnout is driven by format fatigue or topic scatter, switching to a different content structure or narrowing your focus can restore creative energy without a full stop. If it is driven by unsustainable posting frequency, a temporary reduction in volume — even dropping from twice a week to once a week for a month — is often more effective than a complete hiatus, because it maintains channel momentum while allowing recovery.
Ready to see what the data says about your channel?
Stop guessing. Use AskLibra to get a personalized 90-day growth gameplan and find your perfect posting window.
No credit card required • Join 2,000+ creators