
10 Questions Creators Should Be Asking AI Tools About Their Channel Growth
Key Takeaways
- 1
Most creators ask AI tools generic questions and get generic answers — the right questions unlock specific, actionable insights tied to your actual channel data.
- 2
Asking about retention drop-off points, hook rate, and peak posting windows gives you a diagnostic picture of what is broken before you waste time producing more content.
- 3
Format performance and traffic source breakdowns are two of the most underused data angles — AI tools can surface patterns across hundreds of videos that would take weeks to find manually.
- 4
The best question you can ask any AI analytics tool is: 'What is the single biggest gap between my current performance and what my top 10% of videos do differently?'
Why the Questions You Ask an AI Tool Determine the Answers You Get
Most creators open an analytics tool, scroll through some numbers, and close it feeling vaguely informed but practically unchanged. The problem is rarely the tool. It is the questions being asked — or more accurately, the ones that are never asked at all.
AI analytics tools are not search engines for reassurance. They are diagnostic instruments. Ask them vague questions like "how is my channel doing?" and you get vague summaries. Ask them precise, operational questions and you get a prioritized list of things to fix, double down on, or stop doing entirely.
This article gives you 10 specific questions that will change how you use any AI tool connected to your channel data — including how to interpret the answers and what to do next.
The 10 Questions That Actually Move the Needle
1. "What is my hook rate, and how does it compare to my best-performing videos?"
Hook rate is the percentage of viewers who watch past the first 30 seconds of your video. It is the first diagnostic signal for whether your opening is pulling people in or pushing them away. A low hook rate means no amount of strong content in minute three will save you — the audience is already gone. Ask your AI tool to calculate your average hook rate across your last 30 videos, then isolate the top 10% and compare. The gap between those two numbers tells you exactly how much your openings are costing you. For a deeper dive into what makes an opening work, see What is a YouTube Hook and How Long Should It Be?
2. "Where exactly on my retention curve do viewers drop off most sharply?"
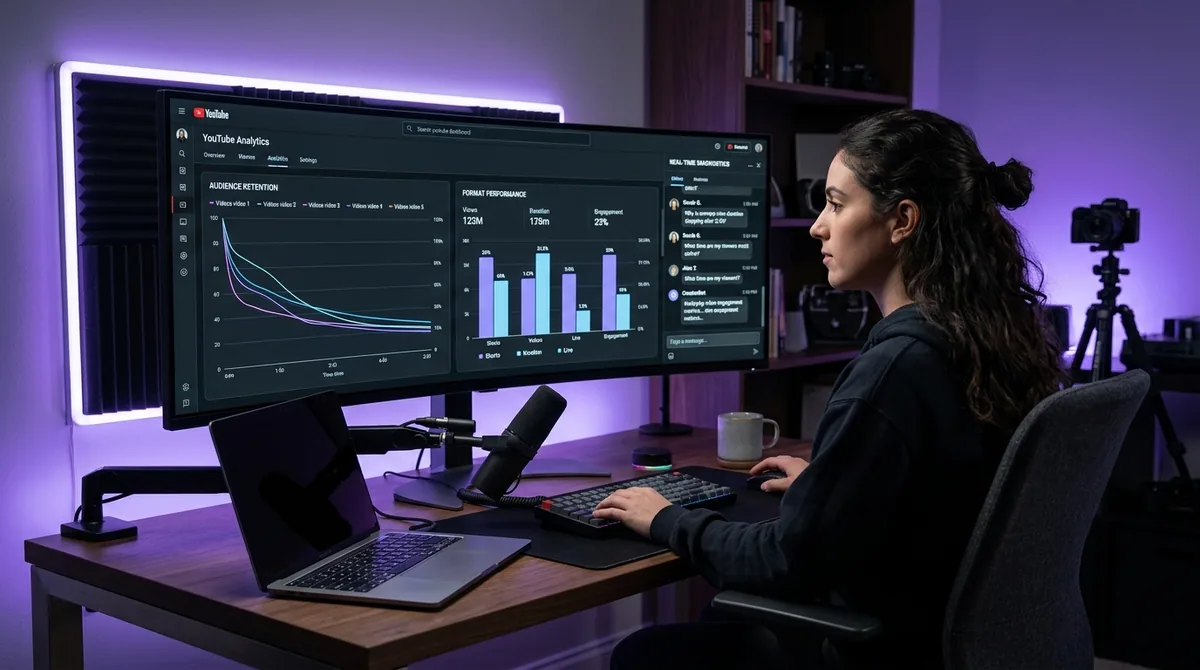
A retention curve is a line graph showing the percentage of your original audience still watching at each second of your video. A sharp cliff — a sudden steep drop — is not just a bad sign, it is a timestamp. It tells you the exact moment something stopped working: a slow transition, a rambling explanation, a topic shift the audience did not expect. Ask your AI tool to identify the top three drop-off timestamps across your last 20 videos. Then go back and watch what is happening at those moments. You will find patterns faster than any amount of guessing.
3. "Which of my video formats is generating the highest engagement rate?"
Engagement rate is the ratio of meaningful interactions — likes, comments, shares, saves — to total views or impressions. It measures how much your content moves people to act, not just watch. Creators often assume longer videos or more polished productions perform better, but the data frequently tells a different story. Ask your AI tool to segment your videos by format — Shorts, long-form, tutorials, vlogs — and rank them by engagement rate. The answer may surprise you. For context on what strong engagement actually looks like, read What Is Engagement Rate on YouTube and What's a Good Benchmark?
4. "What are my peak posting hours based on my specific audience's watch behavior?"
Generic advice says post at 3 PM on Tuesday. Your audience may peak at 9 PM on Thursday. These are not interchangeable. Peak posting hour is the window when your subscribers are most actively on the platform, which directly affects how much early momentum — views, clicks, watch time — your video accumulates in its first two hours. Early momentum is one of the strongest signals the YouTube algorithm uses to decide how widely to distribute a video. Ask your AI tool for your channel's specific peak window, not an industry average. To see how one creator used this exact question to accelerate their results, read How One Creator Stopped Guessing and Grew 40% With Data-Driven Posting Times.
5. "What percentage of my traffic comes from Browse versus Search, and what does that split mean for my strategy?"
Browse traffic means YouTube's algorithm surfaced your video on homepages and suggested feeds — the algorithm chose to promote it. Search traffic means a viewer typed a query and found your video — the viewer chose it. These two sources require different optimization strategies. A channel heavy on Browse traffic needs strong thumbnails and titles that stop the scroll. A channel heavy on Search traffic needs keyword-rich titles and descriptions that match viewer intent. Ask your AI tool what your current split looks like and whether it aligns with how you are actually optimizing. For the full breakdown of why this distinction matters, see Browse vs Search Traffic on YouTube: What's the Difference and Which Matters More?
6. "Which of my video titles had the highest click-through rate, and what do they have in common?"
Click-through rate (CTR) is the percentage of people who saw your video's thumbnail and title and chose to click. It is the first conversion point in your entire funnel. A 2% CTR and a 6% CTR on the same number of impressions can mean the difference between a video that reaches 5,000 people and one that reaches 15,000. Ask your AI tool to pull your top 10 videos by CTR, then identify the structural patterns: question format vs. statement, number-led titles vs. curiosity gaps, specific vs. vague language. You are looking for a repeatable template, not a one-time lucky title. For a complete framework on title construction, see How to Write a YouTube Video Title That Gets Clicked.
7. "What does my 90-day performance trend actually show — and what is driving it?"
A 90-day window is long enough to filter out the noise of individual viral or underperforming videos, and short enough to reflect your current channel direction. Ask your AI tool to analyze your 90-day trend across three metrics simultaneously: average views per video, average watch time, and average engagement rate. If all three are trending up, you have real momentum. If views are up but engagement is flat, you are reaching new people who are not connecting. If watch time is down but views are stable, your content is losing the audience mid-video. Each combination points to a different problem. How AskLibra's 90-Day Analysis Works — And What It Finds in Your Channel explains exactly how this diagnostic process works in practice.
8. "Which topics in my niche are my audience engaging with most, and which ones am I not covering?"
This question has two halves and most creators only ask the first. Knowing your top-performing topics is useful. Knowing the high-engagement topics you have never covered is where the actual growth opportunity lives. Ask your AI tool to map your content against engagement clusters — groupings of videos by topic — and then identify gaps: subjects your audience cares about based on comment patterns, search queries, and related video data that you have not addressed. For a structured method of doing this, see How to Use AI to Generate YouTube Video Ideas That Actually Match Your Audience.
9. "Are my thumbnails consistent with the CTR performance of my top videos?"
Thumbnail consistency is not about aesthetics — it is about training your audience to recognize and click your content on a crowded homepage. Ask your AI tool to correlate your thumbnail design elements — face vs. no face, text overlay vs. no text, color palette, facial expression — with CTR performance. You may find that thumbnails with a specific element consistently outperform your average by several percentage points. That is not a coincidence; it is a template. For a step-by-step method to raise your thumbnail CTR, read How to Improve Your YouTube Thumbnail Click-Through Rate.
10. "What should I stop doing based on the last 90 days of data?"
This is the question most creators skip because it is uncomfortable. But an AI tool analyzing 511 videos across connected channels has no loyalty to your favorite content format or posting schedule. Ask it directly: what formats, topics, posting times, or title structures are consistently underperforming relative to your channel average? The answer is your stop-doing list, and it is often more valuable than any to-do list because it frees up production time to double down on what is actually working. To avoid the most common mistakes creators make when interpreting this kind of data, see The Most Common Posting Mistakes YouTube Creators Make (Based on 90-Day Data).
How to Turn These Questions Into a Repeatable System
Asking these 10 questions once will improve your next video. Asking them on a structured monthly or weekly basis will compound into a channel strategy that is continuously self-correcting. The creators who grow consistently are not the ones who find one viral formula — they are the ones who run the diagnostic regularly and adjust before small problems become plateau-level problems.
A complete system built around these questions — one that ties your analytics review to your content calendar — is exactly what How to Build a Complete Content System Using AskLibra walks through. And if you want to translate the answers into a concrete weekly posting plan, How to Use AskLibra's Weekly Gameplan to Plan a Month of Content shows you how to do that without starting from scratch each week.
Based on AskLibra data from 4 connected channels and 511 videos analyzed, the format with the highest average engagement rate is image-based content at 0.55, followed by carousel albums at 0.51. Among video-specific formats, long-form outperforms Shorts by a factor of more than 2:1 in engagement rate. The question "which format should I be prioritizing?" is one that the data answers clearly — but only if you ask it.
Frequently Asked Questions
What is hook rate and why does it matter for YouTube growth?
Hook rate is the percentage of viewers who watch past the first 30 seconds of your video. It matters because if viewers leave before your content starts delivering value, your watch time and retention metrics suffer, which reduces how widely YouTube distributes the video to new audiences.
How often should I be asking an AI tool these diagnostic questions?
A monthly review of all 10 questions gives you enough data to spot trends without over-reacting to individual video performance. If you are publishing more than four videos per week, a bi-weekly review is more appropriate because your data set grows faster.
What is the difference between Browse traffic and Search traffic on YouTube?
Browse traffic means YouTube's recommendation system placed your video on a viewer's homepage or suggested feed without the viewer searching for it. Search traffic means a viewer typed a query and your video appeared in the results. Each source requires a different optimization approach: Browse rewards eye-catching thumbnails and broad appeal, while Search rewards keyword accuracy and specific viewer intent.
Can I ask these questions using any AI analytics tool, or do I need a specific platform?
Any AI tool that has direct access to your YouTube Studio data — including views, watch time, retention curves, CTR, and traffic sources — can answer these questions. Tools that only use public data or require manual data uploads will give you incomplete answers, particularly on retention curve and hook rate questions.
What does a healthy engagement rate look like on YouTube?
Engagement rate benchmarks vary by channel size and niche. Smaller channels with highly specific audiences typically see higher engagement rates than large general-interest channels. The most useful benchmark is your own channel's historical average — you want to see your engagement rate trending upward over a 90-day window, not just sitting above or below an industry number.
Ready to see what the data says about your channel?
Stop guessing. Use AskLibra to get a personalized 90-day growth gameplan and find your perfect posting window.
No credit card required • Join 2,000+ creators